
Social media analytics across all your platforms.
Track reach, engagement, follower growth, and post performance across all 10 platforms. Compare time periods, find your best content, and post with confidence.
- All 10 platforms
- Best time to post
- Custom date ranges


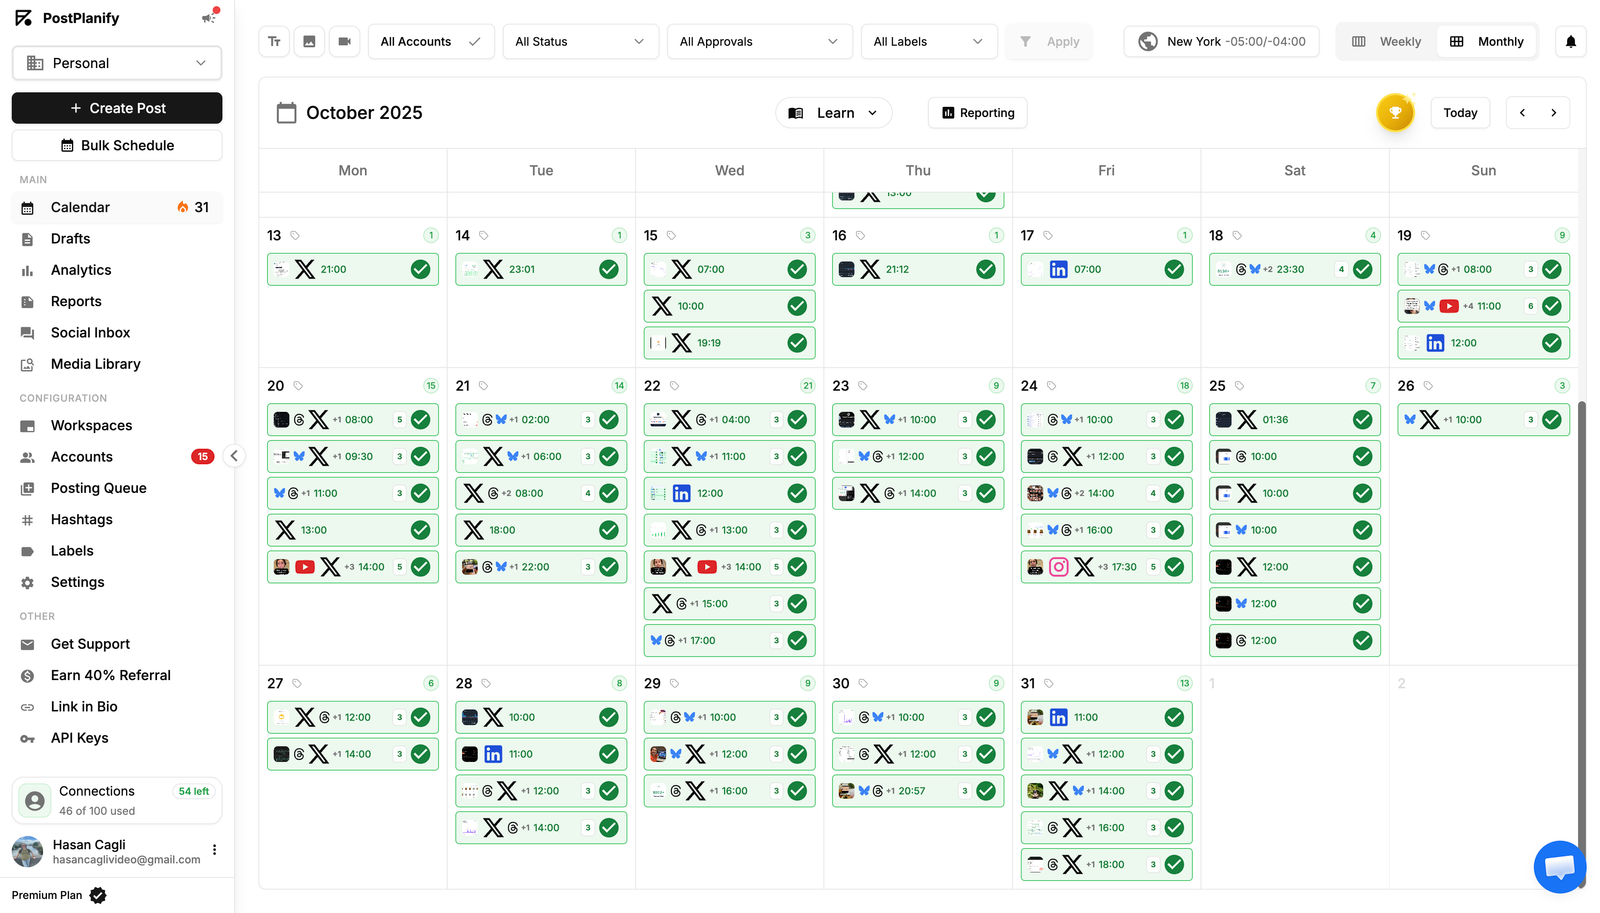
Trusted by agencies and brands in 30+ countries





















Start tracking in 3 steps
Connect your accounts
Link your social accounts to PostPlanify.
Data syncs on its own
Metrics update automatically in the background — no manual refresh.
See what's working
Open one dashboard and track growth across every platform.
Everything you need to measure growth
10 platforms in one dashboard
Instagram, TikTok, X, YouTube, Facebook, LinkedIn, Pinterest, Threads, Bluesky, and Google Business. All in one place.
Historical trends
Daily snapshots track your growth over 7, 14, 30, or 90 days. See how your metrics change over time.
Best times to post
A heatmap shows when your audience engages most so you can post at the right time.
Top performing posts
See which posts are growing fastest. Ranked by recent engagement, not just lifetime numbers.
Per-post metrics
Views, likes, comments, shares, and engagement rate for every post you publish.
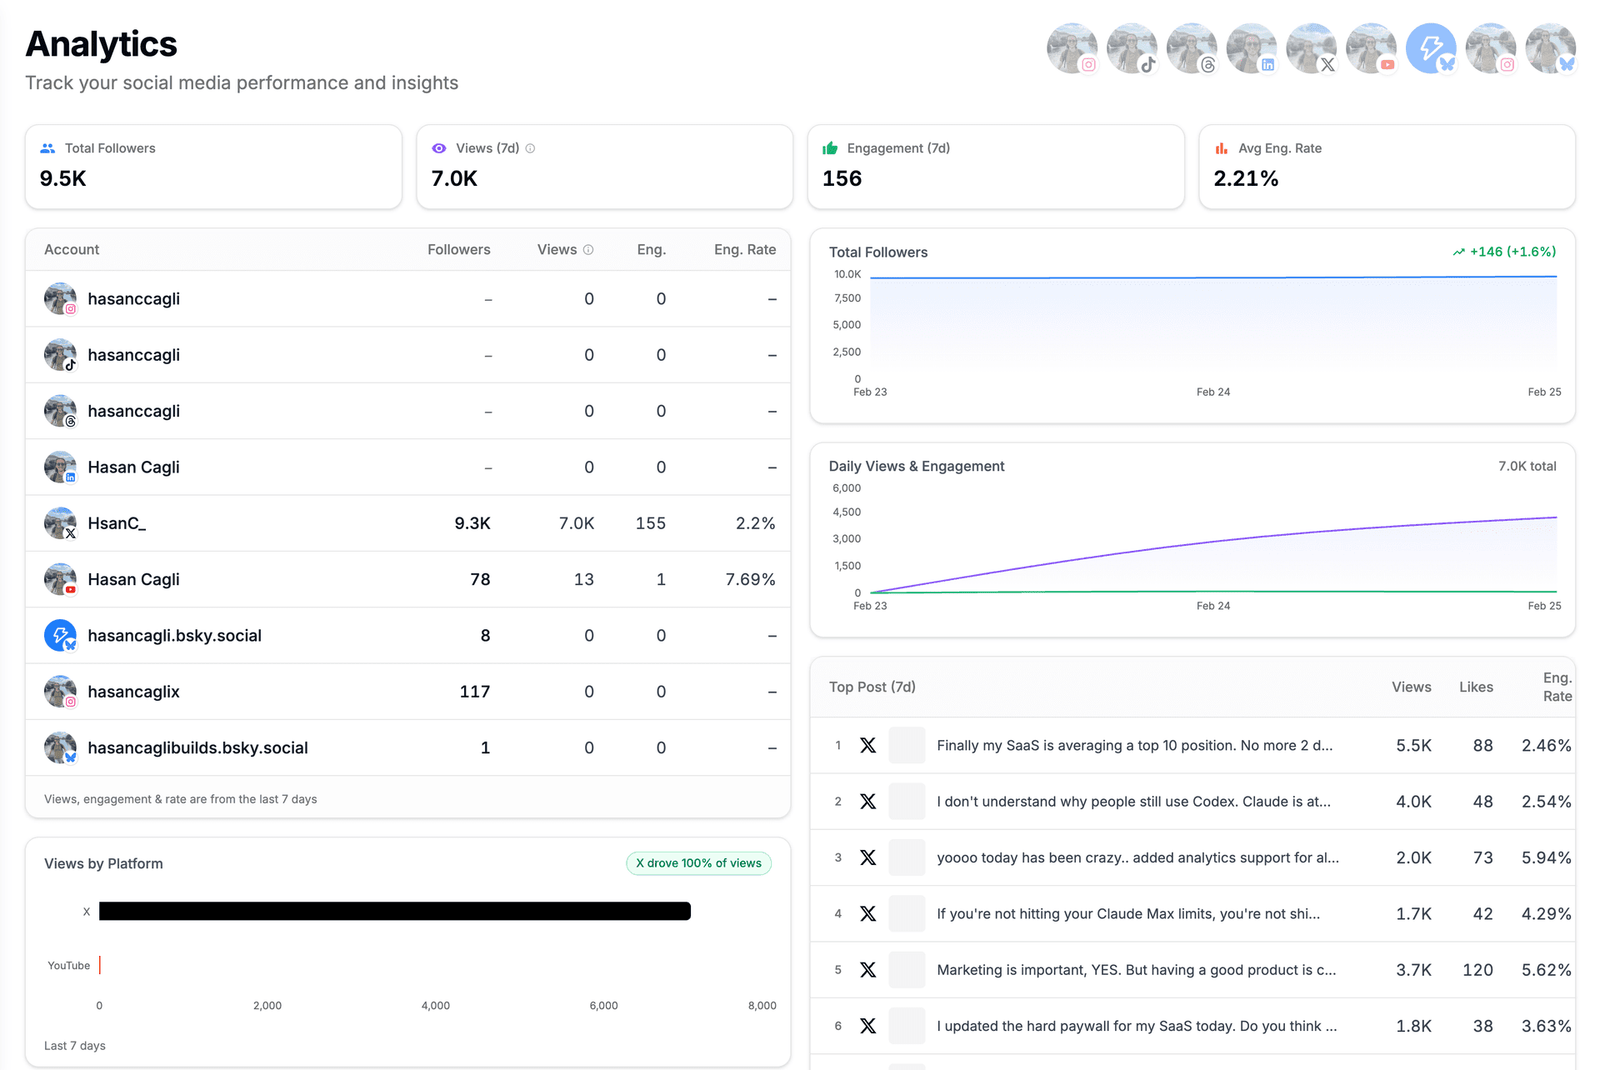
Brand overview
One view across all connected accounts. Total followers, views, engagement, and platform breakdown.
Who uses analytics?
From solo creators to global agencies.
Creators
See which posts drive followers and engagement. Double down on what works.
Small Businesses
Track what content brings clicks and attention. Stop guessing, start measuring.
Agencies
Monitor all client accounts from one dashboard. Spot trends across brands.
What you can track on each platform
Every platform gives you different data. Here's exactly what PostPlanify tracks for each one.
Why track social media analytics?
Posting content without looking at the numbers means you're guessing. Analytics show you what your audience responds to, which platforms bring the most engagement, and whether your following is growing or stagnating. Without that data, you can't make informed decisions about what to post next.
The problem with platform-native analytics
Every social platform has its own analytics section, but they're all different. Instagram shows reach, TikTok shows views, X shows impressions. Switching between 5 or 6 dashboards to understand your overall performance wastes time and makes it hard to compare. A unified dashboard puts everything in one place with consistent metrics.
How PostPlanify analytics work
When you connect your social accounts to PostPlanify, analytics sync automatically. You get a brand overview that aggregates followers, views, and engagement across all accounts. Drill into any account to see per-post metrics, historical trend charts, and a heatmap of your best posting times. Daily snapshots track your growth over time so you can measure what actually changed over the last week, month, or quarter.
Instagram analytics and reporting
PostPlanify tracks your Instagram followers, reach, views, saves, shares, and engagement rate in one place. See how your Reels perform compared to Stories and Carousels. Track profile visits, new follows, and Reels watch time. If you manage multiple Instagram accounts, you can compare them side by side without switching between the Instagram app's built-in insights.
TikTok analytics for creators and brands
Track views, likes, comments, shares, and engagement rate for every TikTok video you post. PostPlanify takes daily snapshots of your TikTok follower count and total likes so you can see exactly how your account is growing over time. Use the best time to post heatmap to find when your TikTok audience is most active.
YouTube analytics in your dashboard
Monitor subscriber growth, video views, likes, and comments for your YouTube channel. PostPlanify tracks performance for both regular videos and Shorts, so you can compare formats and focus on what drives the most engagement. Historical trend charts show how your channel metrics change week over week.
Multi-platform social media reporting
Managing accounts on Instagram, TikTok, X, YouTube, Facebook, LinkedIn, Pinterest, Threads, Bluesky, and Google Business means dealing with 10 different analytics dashboards. PostPlanify combines all of them into one brand overview with total followers, total views, engagement breakdowns by platform, and a single top-performing posts list. For agencies managing multiple brands, each brand gets its own analytics view.
Track your best time to post
PostPlanify analyzes your post history across every connected platform and generates a heatmap showing when your audience engages the most. Instead of guessing whether to post at 9am or 7pm, you can look at real data and schedule your content for the times that consistently get better results.
What You Can Measure
Every metric that matters across every connected platform — in one dashboard.
Reach and impressions
Track total reach, unique impressions, and frequency across every post and platform.
Engagement rate
Likes, comments, shares, and saves calculated per post and aggregated per platform.
Follower growth
Daily, weekly, monthly follower growth with churn tracking and net change.
Best time to post
AI-recommended posting windows based on your audience activity per platform.
Top-performing posts
Auto-surface the posts driving the most reach, engagement, or follower growth.
Content type breakdown
Compare Reels vs feed vs Stories vs video performance side-by-side.
Why analytics change the game
Vanity metrics don't grow accounts. Knowing what works does.
Stop guessing what works
PostPlanify surfaces the content types driving your growth — so you double down on what works and cut what doesn't.
Cross-platform comparison
Compare Instagram to TikTok to LinkedIn in one chart. See where your audience actually engages most.
Best-time recommendations
AI-recommended posting windows per platform based on your audience's historical activity.
Historical trends
Compare any date range against any other date range. Spot seasonality and campaign impact.
48165+
Posts published
10
Platforms supported
180K+
Social accounts connected
Join 2,150+ users who save time every week
See PostPlanify in action
Watch how teams plan, schedule, publish, and report on every social account — all from one dashboard.
Choose Your Plan
Start with a 7-day free trial. Cancel anytime.
Growth
For small teams and solo agency owners managing a few accounts.
$756 billed yearly
- 15 Social Accounts
- 5 Workspaces
- 3 Users
- Unlimited Posts
- Analytics
- Reply to Comments + DMs
- Bulk Schedule
- Media Library
- Shared Calendar
- Link in Bio
- Full API + MCP Access
- AI Assistant
- Custom Integrations*
Premium
For growing agencies with full team collaboration features.
$1,524 billed yearly
- Everything in Growth, plus:
- 30 Social Accounts
- 15 Workspaces
- 6 Users
- Advanced Analytics
- Reports
- Post Approvals
- Team Comments / @Mentions
- Roles & Permissions
- AI Training & Knowledge
- 400 AI Images / mo
Scale
For established agencies managing dozens of clients + need white-label.
$2,292 billed yearly
- Everything in Premium, plus:
- 100 Social Accounts
- 50 Workspaces
- 12 Users
- White-Label PDF Reports
- 800 AI Images / mo
- Priority Human Support
- Dedicated Onboarding & Migration
Enterprise
For larger agencies needing SSO and custom contracts.
Custom billed yearly
Save 20%- Everything in Scale, plus:
- Custom Social Accounts
- Unlimited Workspaces
- Unlimited Users
- Unlimited AI Images / mo
- 1:1 Onboarding Call
- Priority Feature Requests
- Private WhatsApp Support
*Google Drive, Canva, Unsplash and Dropbox
FAQ
Everything you need to know
Which platforms does PostPlanify analytics support?
All 10 connected platforms — Instagram, TikTok, LinkedIn, X, Facebook, YouTube, Threads, Pinterest, Bluesky, and Google Business Profile.
Which platforms does PostPlanify analytics support?
How often does analytics data update?
Most metrics update every 15 minutes. Some platform-native metrics (like Instagram reach) refresh every 24 hours per Meta's API.
How often does analytics data update?
Which plans include analytics?
Every paid plan includes analytics. Higher tiers add custom date ranges, white-label reports, and AI-powered insights.
Which plans include analytics?
Can I see historical analytics data?
Yes — PostPlanify stores all your historical analytics and lets you compare any date range against any other date range.
Can I see historical analytics data?
Can I see analytics for individual posts?
Yes — drill into any post to see reach, engagement, saves, shares, profile visits, and traffic sources.
Can I see analytics for individual posts?
Can I track analytics for multiple accounts at once?
Yes — connect unlimited accounts per platform and view them side-by-side or aggregated in one dashboard.
Can I track analytics for multiple accounts at once?
Do I need a business or creator account for analytics?
Most metrics work with any account. Some advanced metrics (like Instagram reach) require a business or creator account.
Do I need a business or creator account for analytics?
How is engagement rate calculated?
Engagement rate = (likes + comments + shares + saves) ÷ reach × 100. PostPlanify uses platform-standard formulas and shows the breakdown.
How is engagement rate calculated?
How does the best time to post feature work?
PostPlanify analyzes when your audience is most active on each platform and recommends posting windows per account based on historical engagement.
How does the best time to post feature work?
Can I export my analytics data?
Yes — export any chart or full dashboard to CSV, PDF, or shareable live link. White-label exports available on Agency plans.
Can I export my analytics data?
Still have questions?
Can't find the answer you're looking for? Get started with a free trial or chat with our team.
Trusted by 2,150+ businesses
 PostPlanify
Stop guessing. Start tracking what actually works.
Connect your accounts and see your analytics across every platform in one dashboard.
Engagement
+18%
Views
52.8k